KEY (not always used, but used the same way) = Main Points Key Words (get you points on tests) Remember: these will save your life
1/31 - Chapter 10
Overview:
Descriptive Statistics: Sum or Description of a population
Inferential Statistics: Generalization of populations from samples
Sample means (M) or proportions (P) allow us to infer a plausiblevalue of a characteristic
Confidence Intervals:
A sample gives us a statistic (sample M or P). We are unable to say exactly what the population mean or proportion is. To get around this we say we have a confidence that our parameter lies with in an interval. This interval is centered around a sample proportion (a mean). Basically its a point estimate with a margin of error we tack on, a Confidence Interval.
See book Definition for more info
Confidence Level (C): For every Confidence Interval there is a C
C is how much confidence" we have in our method. often choices for confidence levels are 90%, 95%, 99%.
Remember: A Confidence Level is not a probability
How to read a C: a C of 90% means
"in the long run, 90% of the results from this method will capture the true value of the population parameter being estimated within the confidence interval."
See book definition for more info
Applied: Confidence Interval for a pop. mean (we are currently using z-intervals)
To mix up a good C we work with three things
-
SRS
-
Pop. Mean (unknown)
-
Standard deviation (won't have in reality, but have in current problems)
In order to use z-intervals we MUST have #'s 1 and 3.
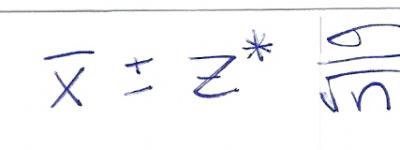
A level C confidence interval of M is:Z* (actual symbol) = Upper Critical Value of S.N.D. (z-distributions!)Here is a complete problem:
Translated this means C is dervided from the SRS mean plus and minus Z* times the standard deviation over the population2
Where as Z* is the positive value of the area to the left of one half the non confidence. A confidence of 99% leave 1% left over, half that is .005 - find that on the Z-Score box or witht he calc controls below and BAM you have your Z*!
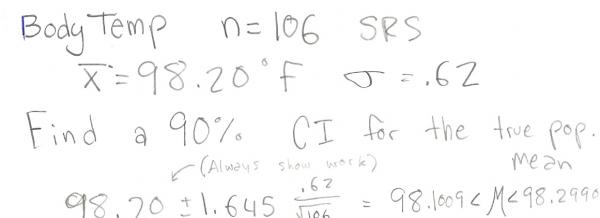
How do we find the Z*? just use {2nd} {Distr} -> {3}(invNorm) this gives -> invNorm(area to left)Remember: book may write in interval notation: (98.1069,98.2991) Don't write this way! We write like this: 98.1009<M<2.9906
Text reads "always show work"
2/1 - Chapter 10
Steps for full credit on interval problems:
1. Name the Interval
Z-Interval for population mean
2. State and Check the conditions
- SRS
- Standard Deviation Known
- "Something about Norm Dist."
A) Given population distribution is approximately normal
or
B) Sampling Distribution is Approximately normal, n is large by the central limit theorem.
Remember: Do not use "it" when writing any of this!!!
3. Show the work
4. Write your final answer with the mean in between (_________<M<_________)How to Interpret a C
Pat Phrase (plug in your own data in the underline sections):
"I am 99% confident that the true mean number of years general managers spend with the company is between 11.01 and 12.59"

